
Updated
Solar · Thermal + RGB drone inspection
Solar inspection software: from drone flight to panel-level report
VisionRepo Solar is solar inspection software for drone solar panel inspection. It analyzes radiometric thermal and RGB drone photos with AI, finds and classifies panel defects, and pins each one to its exact panel. It works for solar farms and rooftops and writes Critical, Mild and Low PDF reports. Self-serve, priced by MW. Not electrical PV testing or checklist software.
For drone solar inspection with supported DJI thermal cameras. Radiometric thermal + RGB. Reports by email.

The problem
Why does a drone solar panel inspection report take so long?
Manual thermal review is the process of inspecting drone-captured thermal images one by one to find panel anomalies. The solar panel thermal inspection flight is the quick part. The review is where the time goes.
5–10 h
5 to 10 hours of drone infrared inspection covers a 4 MWp plant under ideal conditions, according to IEA PVPS Task 13 (Report IEA-PVPS T13-10:2018). The review of those photos is the slow part.
Frame by frame
Every thermal photo is opened and read by a person, one at a time, in desktop thermal analysis software.
Which panel was it?
A hot spot on a photo still has to be traced to a row, a table and a panel before anyone can fix it.
Reports scattered
Each flight's findings sit in their own folder, so last season's results are hard to put next to this one's.
Bad flights found late
Low overlap or missing temperature data shows up during review, after the crew has left the site.
How it works
How does AI solar inspection work?
AI solar inspection is a drone image analysis workflow that turns paired thermal and RGB drone photos into a located, classified defect list. It takes three steps.
 01
Fly
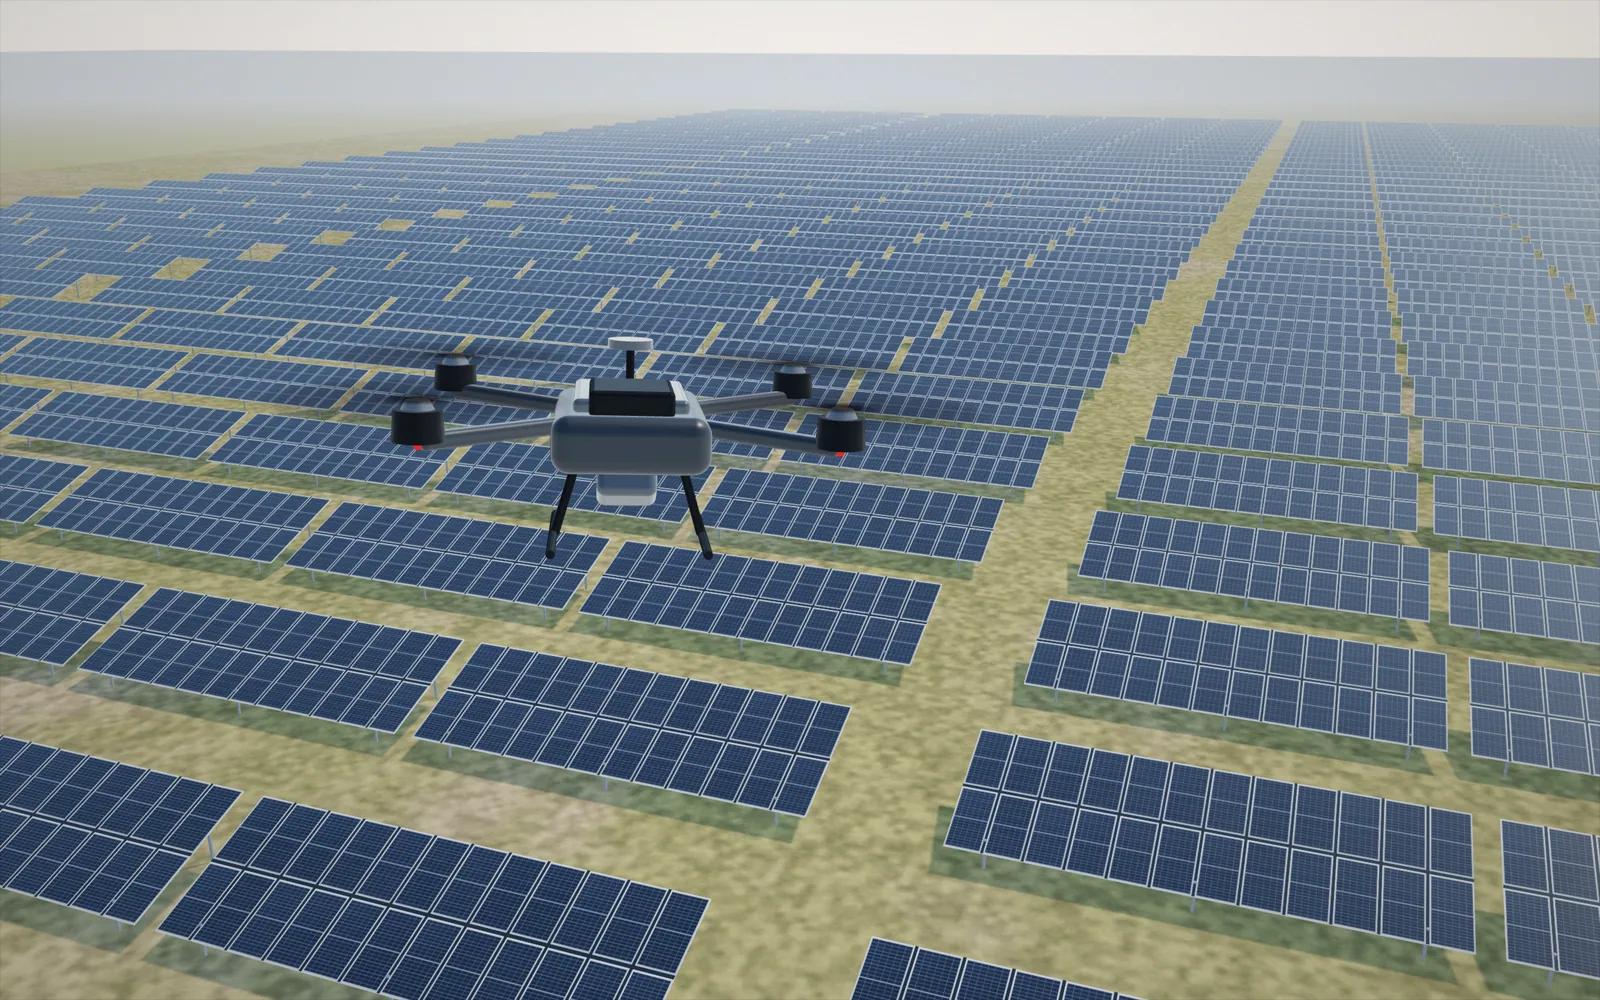
Fly the site with a supported DJI thermal drone. RTK on, 85–90% front overlap, lawnmower lines North–South. The same flight plan works for solar farm drone inspection and rooftop arrays. See the requirements
 02
Upload
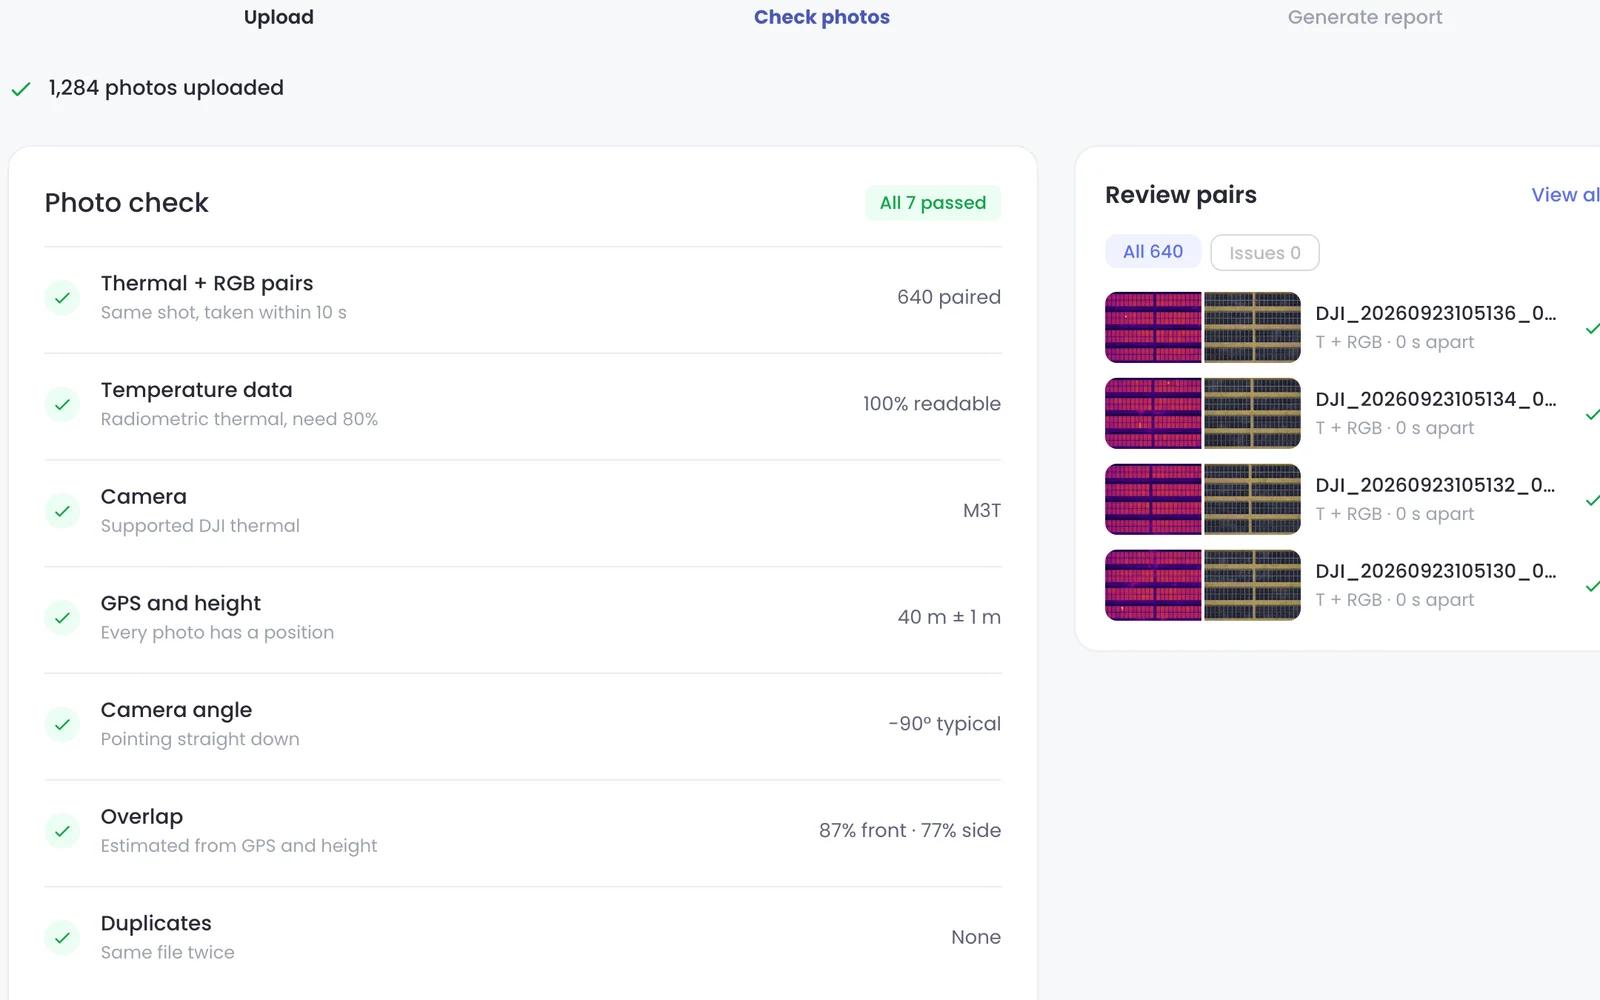
Drop the flight's photos or a ZIP. Seven checks run while they upload: thermal + RGB pairs, temperature data, camera, GPS and height, camera angle, overlap and duplicates.
 03
Get the reports
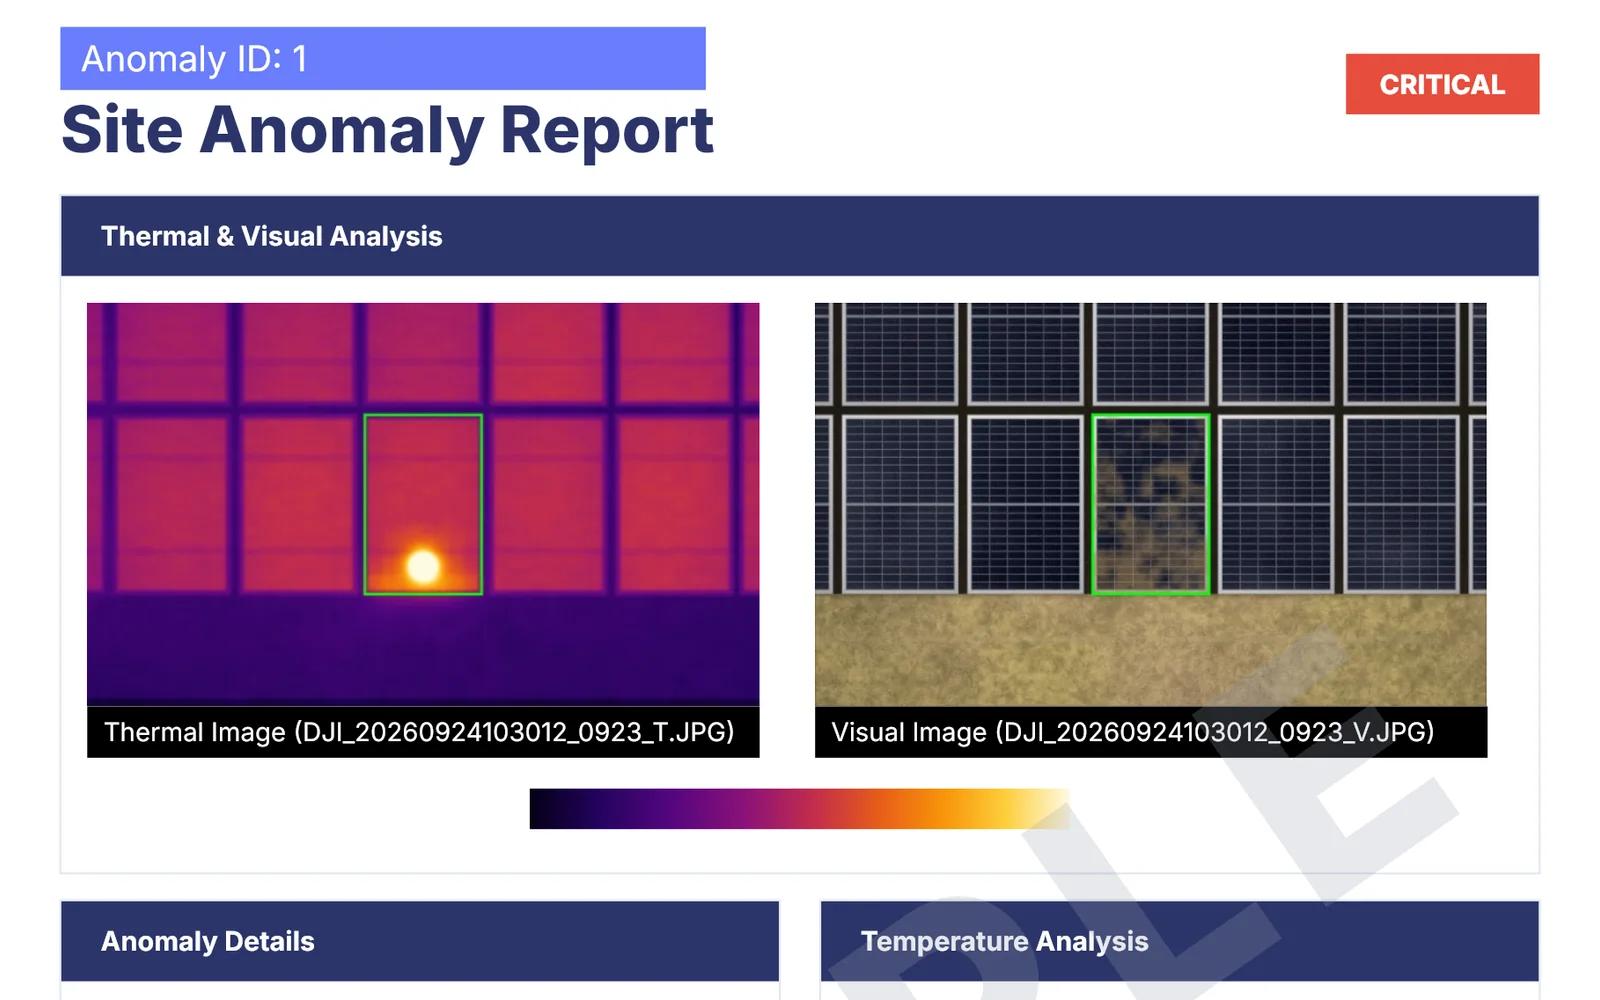
Each anomaly gets a type, a cause, a severity and an exactLocation™ panel code, with its thermal and RGB photos. Critical, Mild and Low PDFs arrive by email.
Inside a run
Find defects
Solar panel defect detection on the thermal and RGB photos, and panel detection on the RGB ones.
Build site map
Calibrates the thermal camera and stitches the RGB photos into an orthomosaic of the whole site.
Locate panels
Finds every panel on the map, lines up thermal and RGB, and puts every thermal anomaly on its panel.
Write reports
One PDF per severity: Critical, Mild and Low.
Chapters
Read the transcript
0:02 Add a site: a solar farm or a rooftop. Report details print on every report.
0:14 Drop the flight's thermal and RGB photos.
0:18 Seven photo checks run while they upload.
0:24 Generate the report. The run finds defects, builds the site map and locates each panel.
0:33 Critical, Mild and Low reports, each anomaly on its panel. Every anomaly in thermal and RGB, with a suggested action.
What it detects
What defects does thermal + RGB inspection detect?
Thermal + RGB inspection is solar panel defect detection from drone photos. It finds panels that run hotter than their neighbours, then reads the RGB photo of the same panel to show why. Each anomaly gets a type from the thermal photo, a cause from the RGB photo and a severity from its temperature analysis.
Infrared imaging alone cannot identify every defect type, because not every module failure raises temperature (IEA PVPS Task 13, Report IEA-PVPS T13-10:2018). For the anomalies that do show on thermal, the RGB photo of the same panel names the cause, such as soiling, shading or a crack.
Anomaly types: the common solar panel defects a thermal camera can see
- Hotspot (hot spot)
 Thermal
 RGB
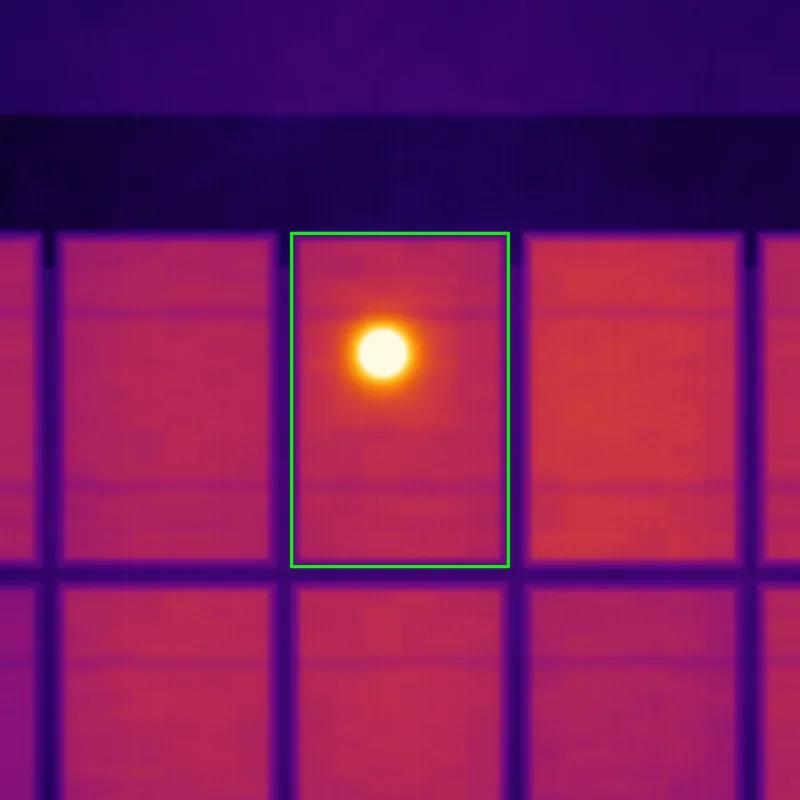
A hotspot is a single cell that runs hotter than the cells around it.
- On thermal
- One bright point on one cell
- Suggested
- Inspect the cell on site
- Multi hotspots
 Thermal
 RGB
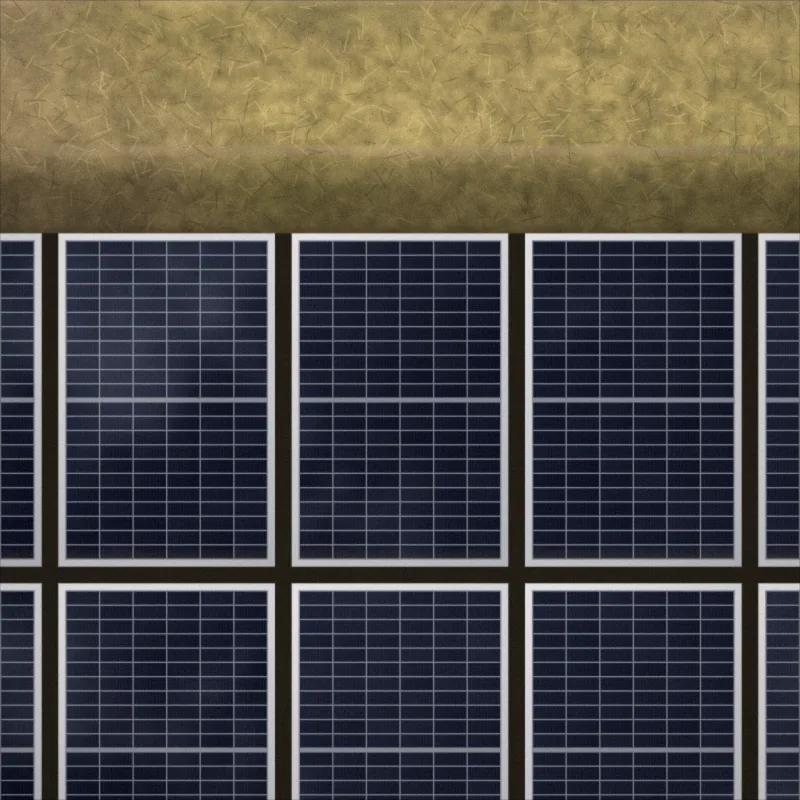
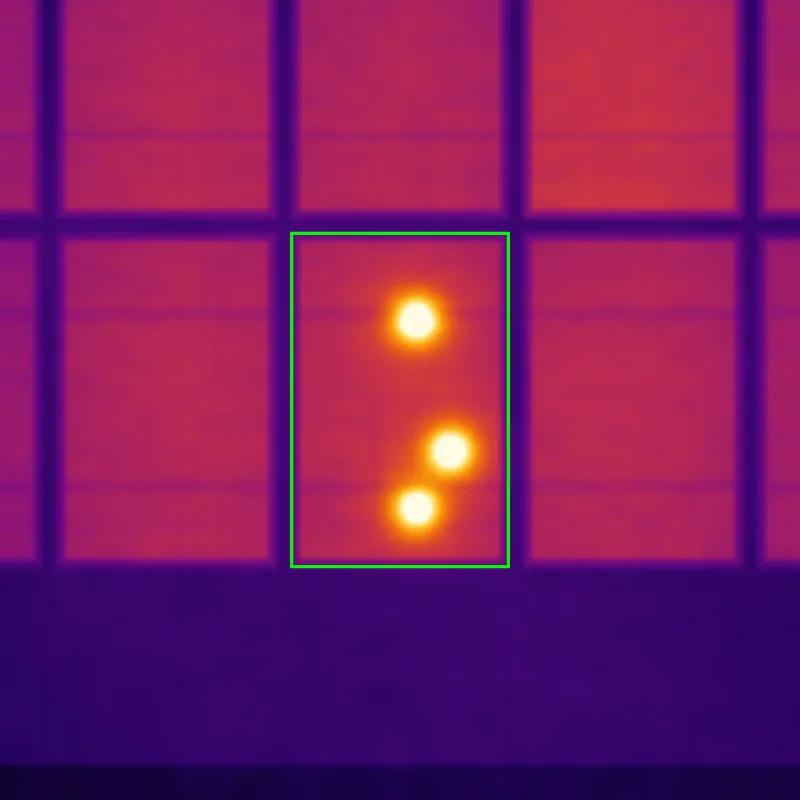
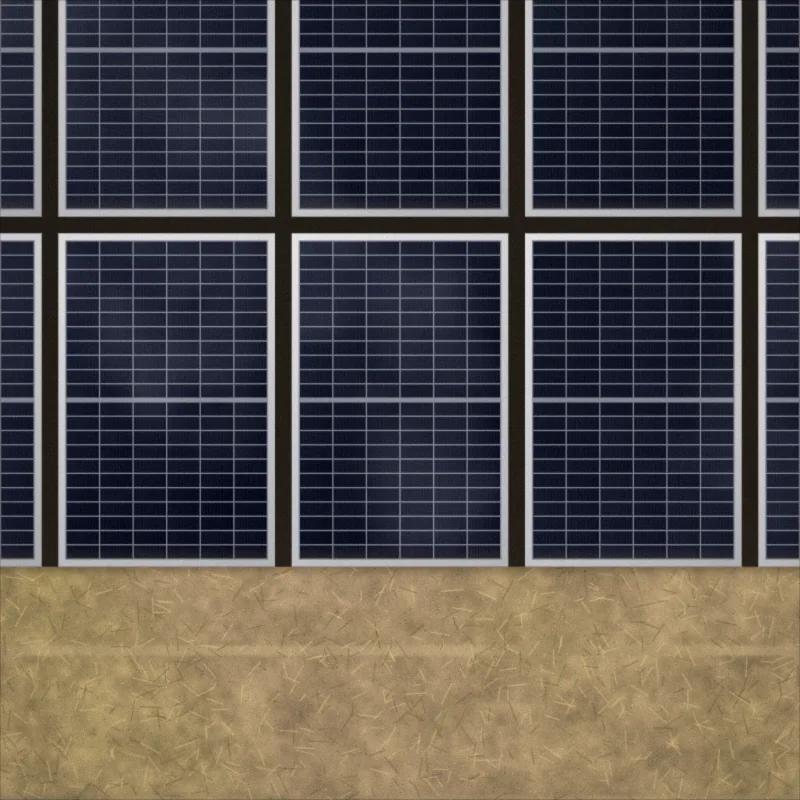
Multi hotspots are several hot cells on the same panel.
- On thermal
- Two or more bright points on one panel
- Suggested
- Inspect the panel on site
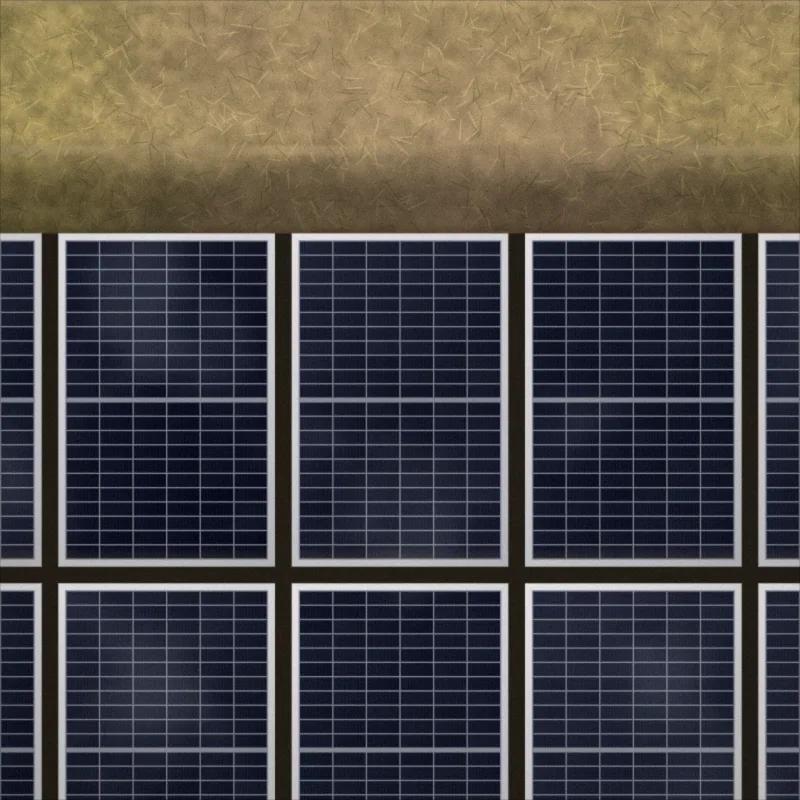
- Bypass diode
 Thermal
 RGB
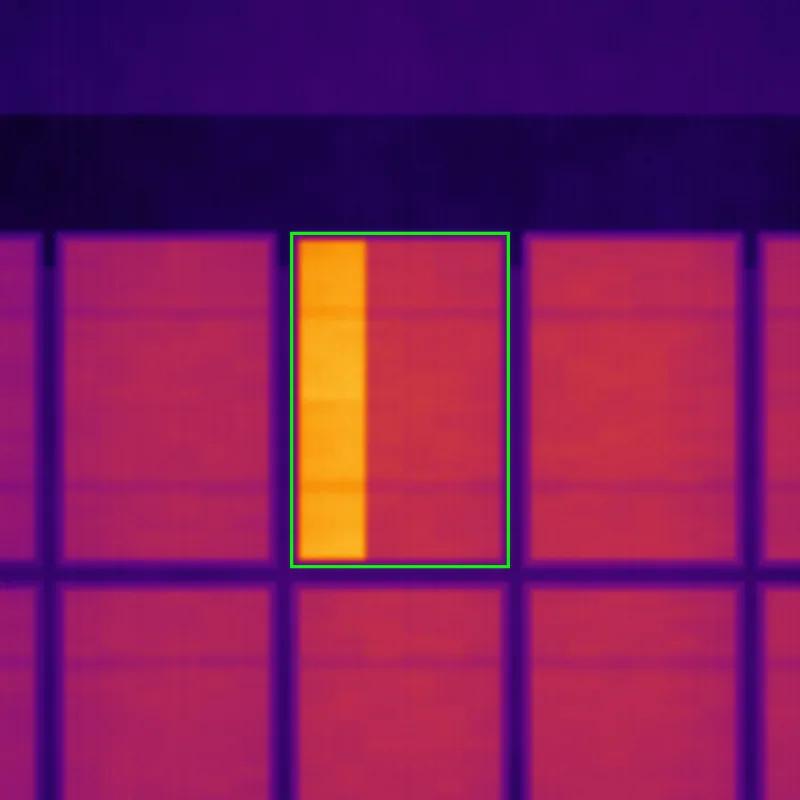
A bypass diode anomaly is a third of a panel running hot because a bypass diode is conducting.
- On thermal
- One third of the panel evenly warm
- Suggested
- Check the bypass diodes
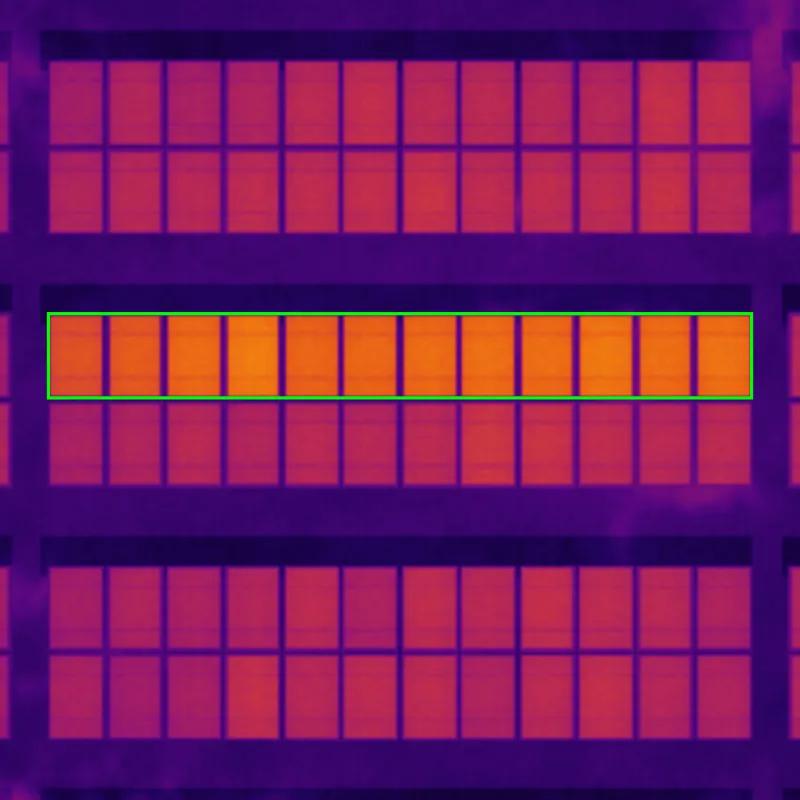
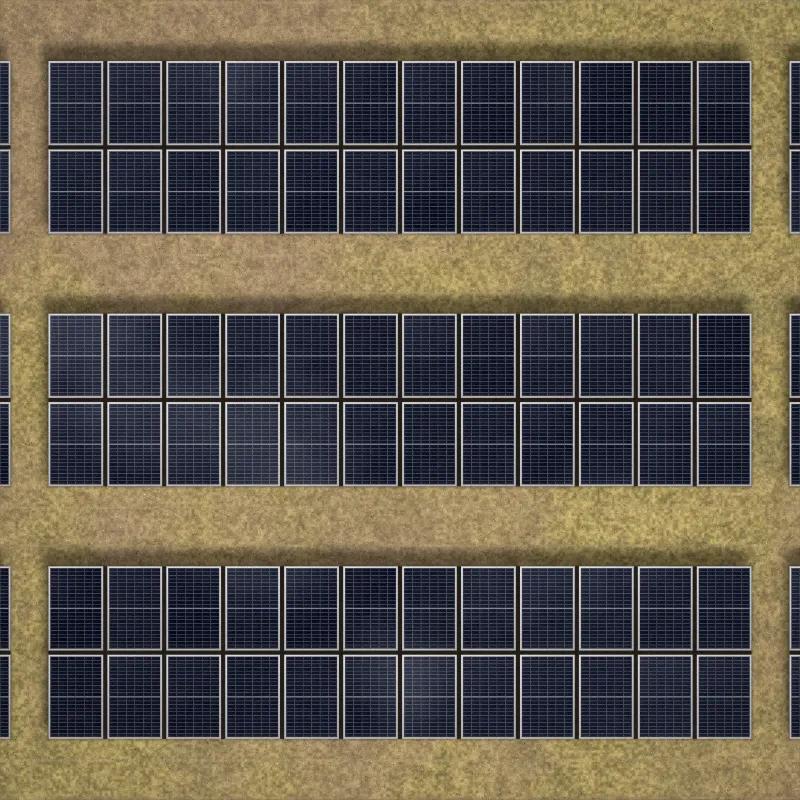
- Open string
 Thermal
 RGB
An open string is a string of panels that is disconnected, so none of its panels deliver power.
- On thermal
- Every panel in the string evenly warmer than its neighbours
- Suggested
- Check the string's wiring
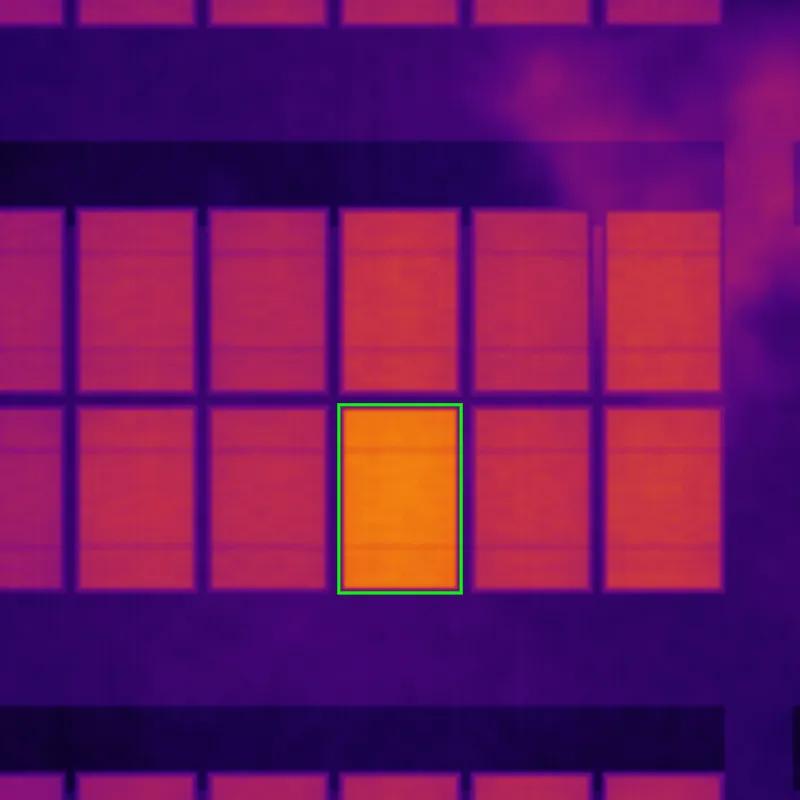
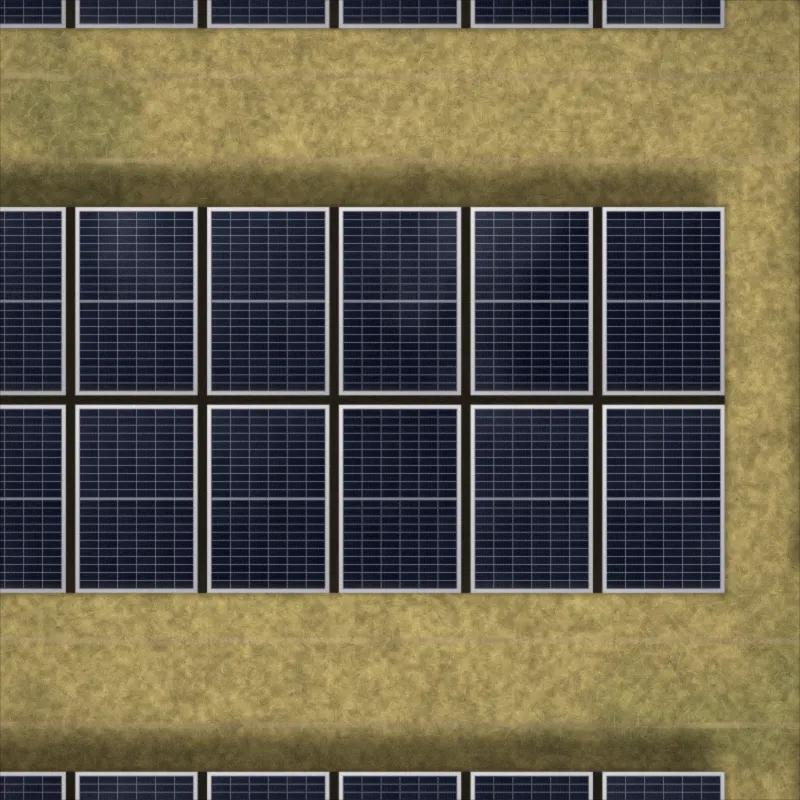
- Open circuit
 Thermal
 RGB
An open circuit is a single panel that is disconnected, so it delivers no power.
- On thermal
- The whole panel evenly warmer than its neighbours
- Suggested
- Check this panel on site
- Severity
Every anomaly gets a severity from its temperature analysis. Reports list critical first, and each severity has its own PDF.
- CriticalListed first
- MildOwn PDF
- LowOwn PDF
Each anomaly also lists its min, max, mean and delta (ΔT) temperatures.
Causes read from the RGB photo
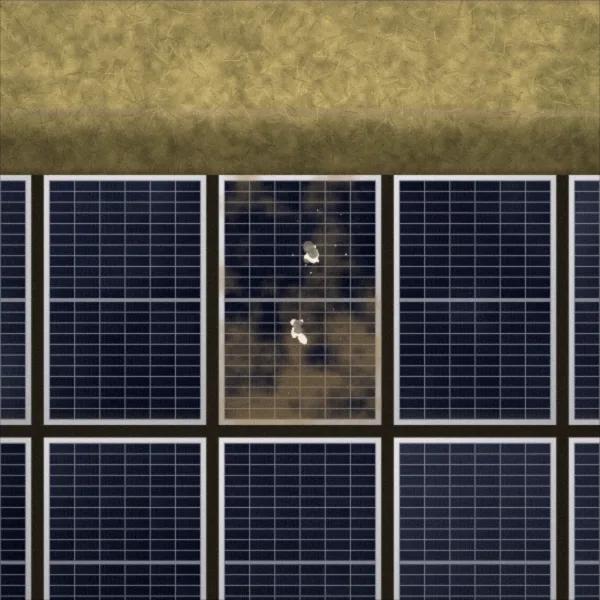
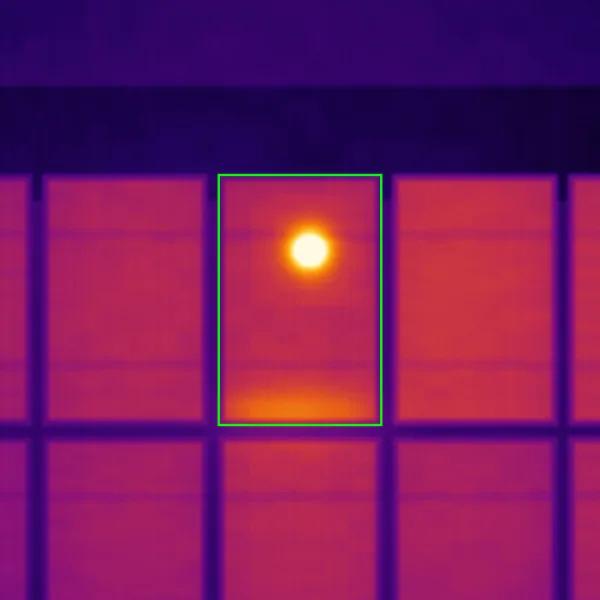
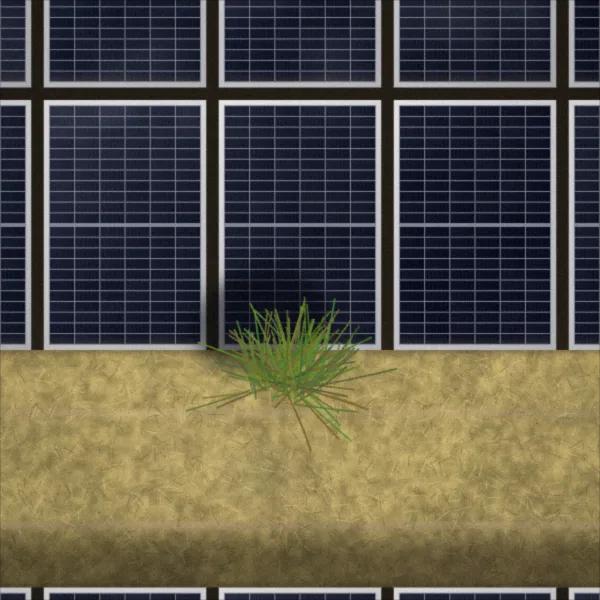
Paired RGB and thermal photos confirm whether a thermal anomaly comes from a defect or from something on the panel. The cause sets the suggested action.
- Soiling and bird droppings
 RGB
 Thermal
- Suggested Clean the panel
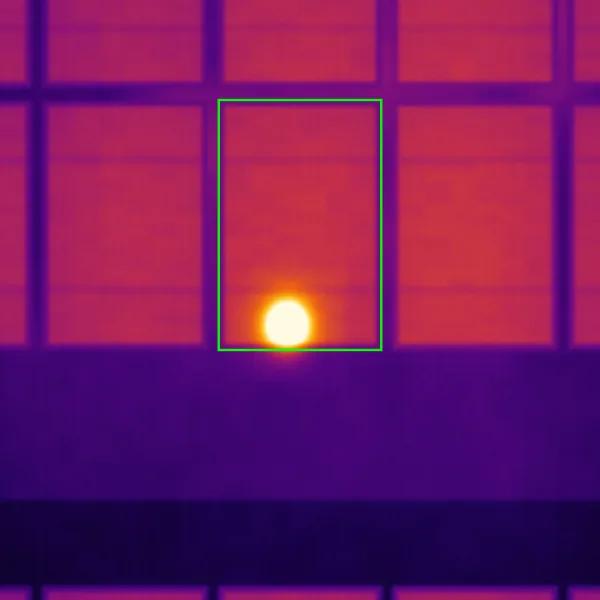
- Shading and vegetation
 RGB
 Thermal
- Suggested Remove what casts the shadow, trim the vegetation
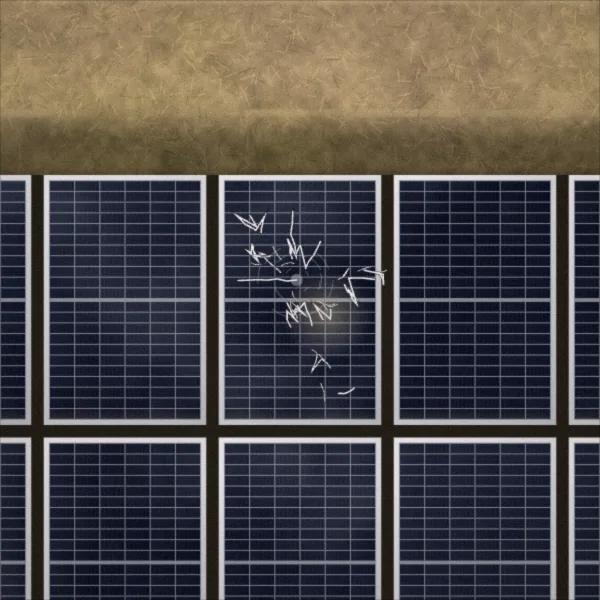
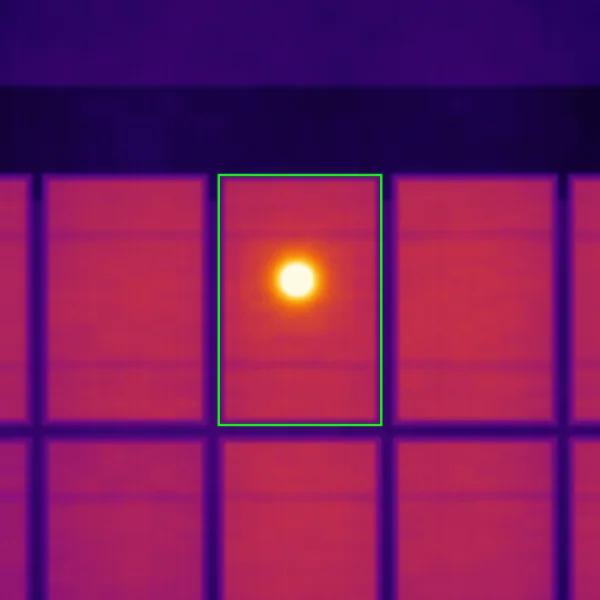
- Cracked solar panels, broken glass, delamination
 RGB
 Thermal
- Suggested Replace the panel
Defect terms follow Köntges, M. et al., Review of Failures of Photovoltaic Modules, IEA PVPS Task 13, Report IEA-PVPS T13-01:2014, and IEA PVPS Task 13, Review on Infrared and Electroluminescence Imaging for PV Field Applications, Report IEA-PVPS T13-10:2018.
Built for every team on the site
Solar farms and commercial rooftops, flown by your own crew or a contractor.
Drone operators and thermal inspection companies
Turn every flight into a client-ready report
- Seven photo checks during upload, so a bad flight shows up before review
- One PDF per severity, each anomaly with its panel code, photos and temperatures
- Drone inspection software with an API: upload photos and start runs from your own systems
O&M teams
A repair list a technician can walk to
- Anomalies sorted critical first, each with a suggested action
- Panel codes by zone, row, table and panel on farms; zone, table and panel on rooftops
- Every PV inspection flight of a site in one place, latest results side by side
Asset owners and managers
Reports you can read without the software
PV modules and systems degrade at a median 0.5% per year across nearly 2,000 field-measured rates (Jordan and Kurtz, NREL, 2013). Faults that push a panel past that, such as hot spots, bypass diode failures or open circuits, show up as anomalies in the next flight's report.
- Site plan, anomalies by type and one page per anomaly, in a PDF
- Share a flight with your contractor or client, to view or to edit
- Your site's own details printed in every report: peak power, panels, inverters
Compared
VisionRepo Solar vs manual review in thermal analysis software
Manual review means reading each thermal photo in a desktop tool such as FLIR Thermal Studio or DJI Thermal Analysis Tool. VisionRepo Solar is drone inspection software that reads every thermal + RGB pair and writes the report.
| Criterion | Manual reviewFLIR Thermal Studio, DJI Thermal Analysis Tool | VisionRepo Solar |
|---|---|---|
| Who reads the photos | A person, one frame at a time | AI, on every thermal + RGB pair |
| Time to a report | Grows with every photo reviewed | Several hours for a large site, unattended |
| Defect location | Traced by hand from the photo | exactLocation™ panel code, from RTK-positioned photos |
| Cost model | Analyst hours | Per report, by site MW, published on this page |
| Earlier flights | Files in folders | Every flight's reports on the site, latest results side by side |
| Flight problems | Found during review | Flagged by the photo check during upload |
Pricing
How much does solar inspection software cost?
VisionRepo Solar is part of the Pro and Ultra plans. Each report costs a base fee plus a rate per MW of the site, so your solar panel inspection cost scales with the site, not with analyst hours. Most platforms quote on request. Ours is on the page.
Report price = base fee + site MW × your plan's rate per MW
Pro
For installers, C&I and rooftop O&M
$20/monthor $200 a year
- Base fee per report
- $49
- Per MW, reports up to 100 MW
- $55
- Per MW, reports over 100 MW
- $45
2 MW site: $49 + 2 × $55 = $159 a report
Ultra
For utility-scale operators and O&M providers
$200/monthor $2,040 a year
- Base fee per report
- $0
- Per MW, reports up to 100 MW
- $40
- Per MW, reports over 100 MW
- $30
300 MW site: 300 × $30 = $9,000 a report
- Charged once the report is ready, on the site's DC capacity in MW.
- At least 1 MW per report.
- A report over 100 MW pays the lower rate on every MW.
- On monthly plans, Ultra costs less than Pro from about 9 MW, or three reports, a month.
Every report includes, on both plans
- Critical, Mild and Low PDF reports
- exactLocation™ panel code per anomaly
- Thermal and RGB photos and temperatures per anomaly
- Seven photo checks during upload
- Results and anomaly viewer in the app
- Email when the reports are ready
Data encrypted at rest and in transit (AES-256, TLS 1.3).Payments by Stripe, PCI DSS Level 1.
Requirements
What drone and camera do you need?
A solar inspection flight is a drone (UAV) survey that captures every shot twice, once with a radiometric thermal camera and once with an RGB camera. The same aerial thermography flight plan covers solar farm drone inspection and rooftop sites. A run can only analyse complete thermal + RGB pairs.
| Drone and cameras | |
|---|---|
| Positioning | RTK on, for centimetre-level positions |
| Thermal camera | Radiometric, 640 × 512 or 1280 × 1024 |
| RGB camera | At least 4000 × 3000 |
| Files | Original DJI photos, not renamed, exported or resized |
| Flight plan | |
| Pattern | Lawnmower lines North–South, heading North |
| Overlap | 85–90% front, at least 75% side |
| Gimbal and height | 5–10° off nadir, constant height above the panels |
| Ground resolution | ~10 cm/px overview · ~5 cm/px module-level O&M · ≤ 3 cm/px cell-level, commissioning and warranty |
| Conditions per IEC TS 62446-3 | |
| Irradiance | At least 600 W/m², stable |
| Wind and sky | Wind up to 7 m/s, clear sky |
| Modules | Dry: no dew, rain or snow |

Supported DJI thermal cameras
- Zenmuse XT2
- Zenmuse XT S
- Zenmuse H20T
- Zenmuse H20N
- Zenmuse H30T
- Mavic 3T
- Matrice 3TD
- Matrice 30T
- Matrice 4T
- Mavic 2 Enterprise Advanced
The full flight requirements
Overlap, gimbal angle, altitude, speed and weather, with good and bad examples.
Conditions follow IEC TS 62446-3:2017, Photovoltaic (PV) systems, Part 3: Photovoltaic modules and plants, Outdoor infrared thermography.
Solar inspection questions, answered
Get started
Your next flight could be your first report.
Add a site in about two minutes. Upload when you land.
Sources: IEC TS 62446-3:2017 · IEA PVPS Reports T13-01:2014 and T13-10:2018 · Jordan and Kurtz, Progress in Photovoltaics, 2013